Buoy Explorer iOS App
Frequently Asked Questions
- Where does the buoy data come from?
- The buoy I'm interested in does not have swell data or is missing something else
- There are no buoys in my area
- The app is not working, all I see is a black screen or similar
- How do I favorite a buoy?
- How do I unfavorite a buoy?
- How do I change the order of my favorite buoys?
- How can I find buoys near me?
- How do I navigate between my favorite buoys?
- How is buoy data collected?
- What is swell/wave height?
- What is swell/wave period?
- What is swell/wave direction?
- What is wind speed?
- What is wind direction?
- The reported data does not appear to be accurate
- My question has not been answered
- Who created Buoy Explorer?
Where does the buoy data come from?
The data is provided by the National Oceanic and Atmospheric Administration (NOAA) National Data Buoy Center (NDBC), a part of the National Weather Service (NWS). NDBC designs, develops, operates, and maintains a network of data collecting buoys and coastal stations.
Back to topThe buoy I'm interested in does not have swell data or is missing something else
NDBC provides hourly observations from a network of about 90 buoys and 60 Coastal Marine Automated Network (C-MAN) stations. All NDBC managed stations measure wind speed, direction, and gust; barometric pressure; and air temperature. In addition, all buoy stations, and some C-MAN stations, measure sea surface temperature and wave height and period. Conductivity and water current are measured at selected stations. NDBC managed stations typically have a 5 digit name like 42035, 41009, or 41012.
Back to topThere are no buoys in my area
Most NDBC stations are located at sites determined by NWS forecast and warning requirements. Some are installed and maintained in areas identified through reimbursable funding agreements with other agencies and private sector institutions. Even though buoys are not installed in as many locations as we would like the locations of buoys have been purposefully picked to allow all locations to infer local conditions based on nearby buoys. If there is not a buoy in your immediate location please find a nearby buoy and base your local conditions off of that buoy.
Back to topThe app is not working, all I see is a black screen or similar
Please force close the app and relaunch it. If that does not work please force close all apps, restart your device, and then relaunch the app. If you are still having issues please contact support.
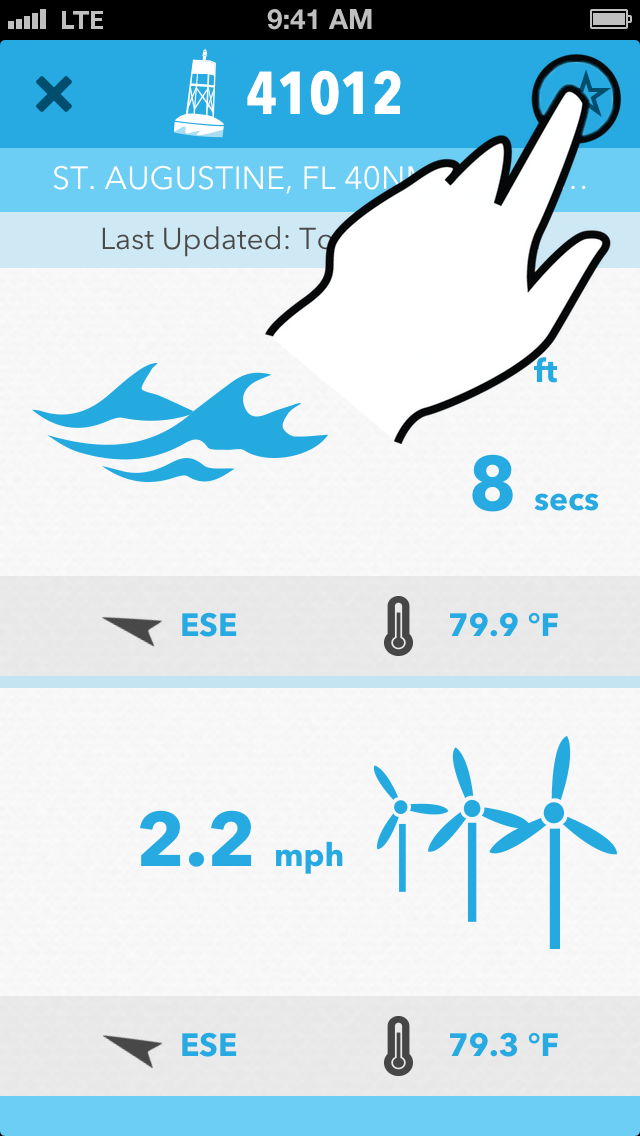
Back to topHow do I favorite a buoy?
To favorite a buoy tap on the star icon in the top right of the main screen.
Back to top
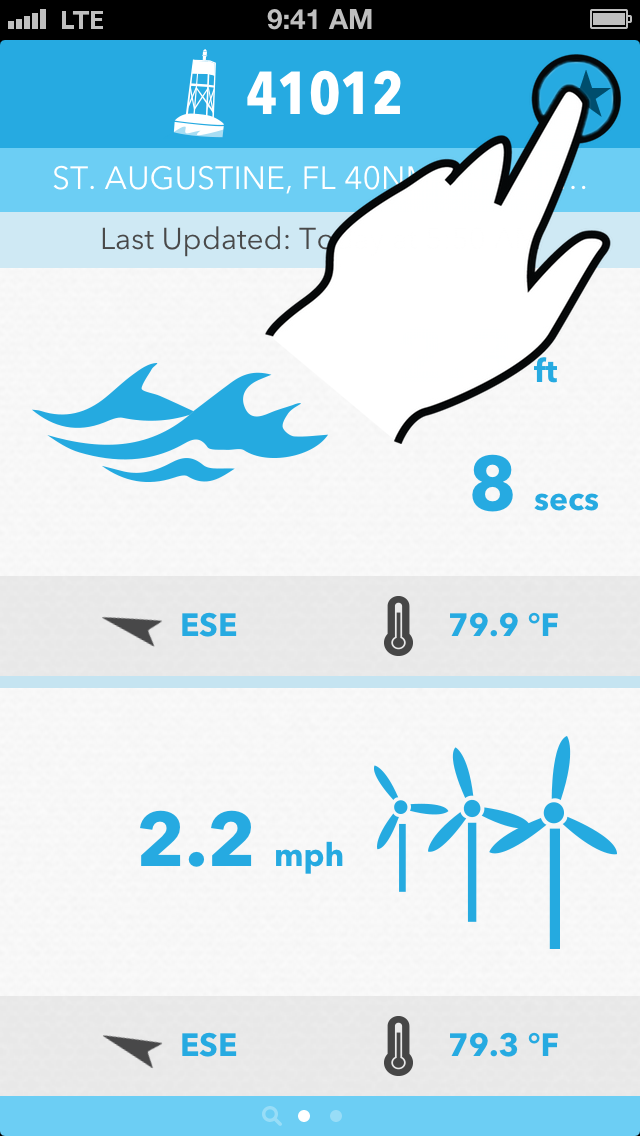
How do I unfavorite a buoy?
To unfavorite a buoy top on the star icon in the top right of the main screen.
Back to top
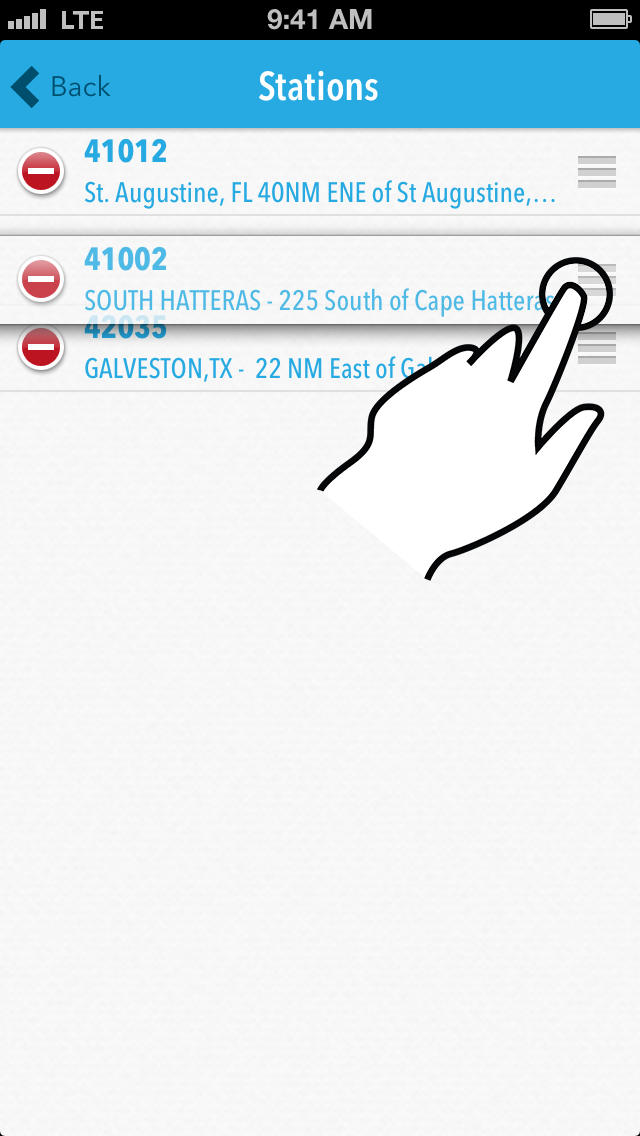
How do I change the order of my favorite buoys?
To change the order of your favorite buoys tap on the gear icon then tap on the Edit Stations button. Reorder the stations as you see fit by tapping on the right side of the row and dragging.
Back to top
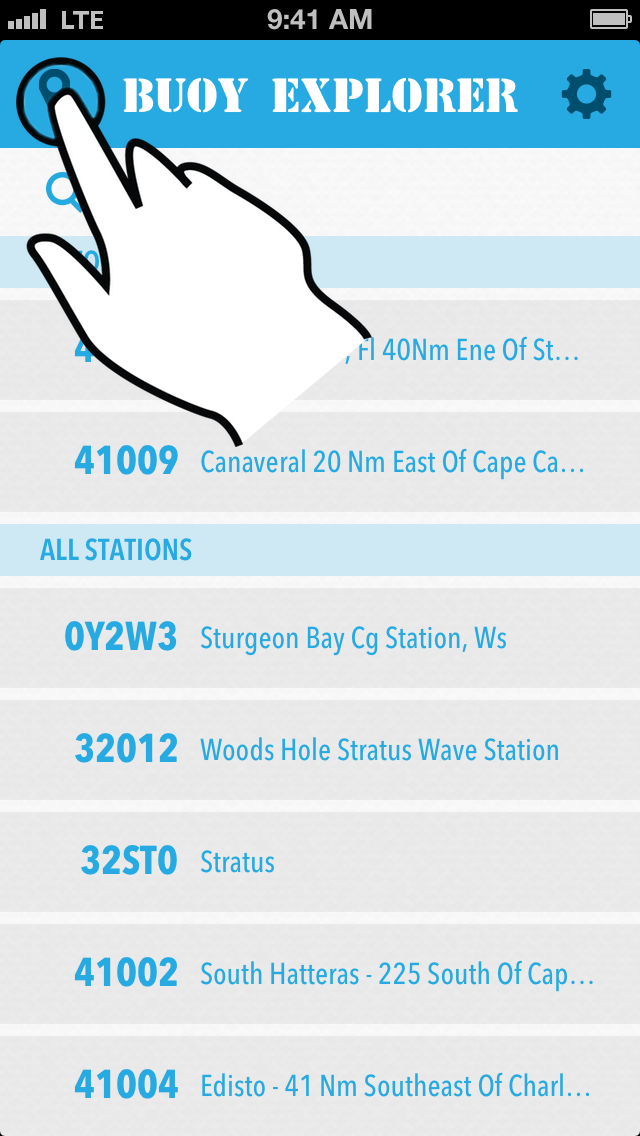
How can I find buoys near me?
To find buoys near your current location tap on the map icon.
Back to top
How do I navigate between my favorite buoys?
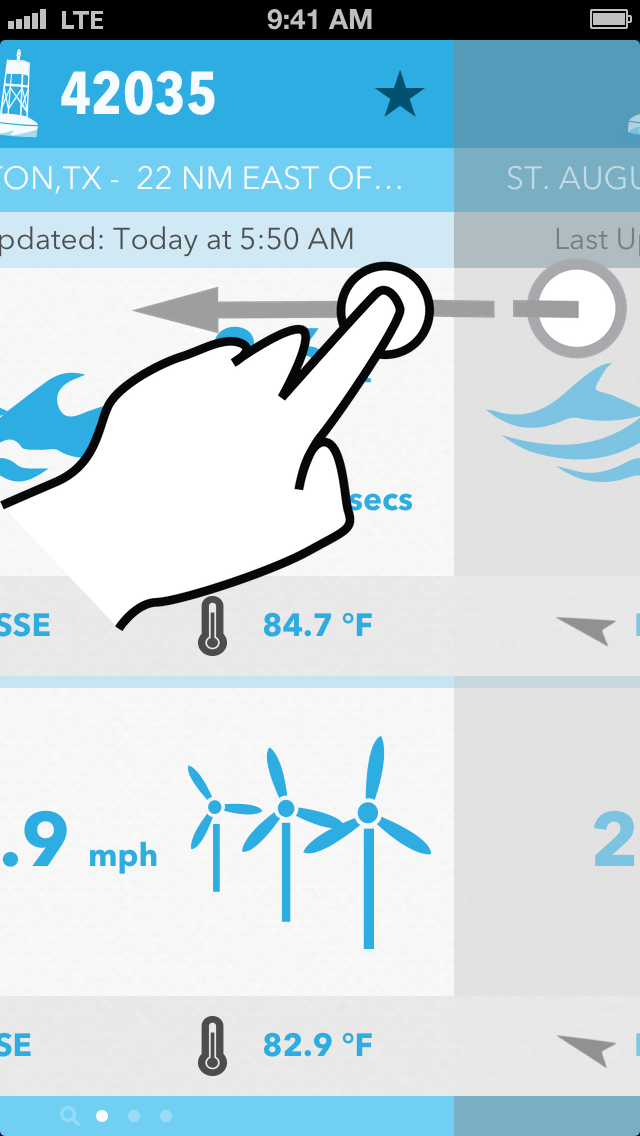
To switch between your favorite buoys swipe left or right with one finger when viewing a buoy. Alternatively, tap on a station under the favorite section from the list of stations.
Back to top
How is buoy data collected?
NDBC uses commercially available sensors such as anemometers to measure wind speed and direction and barometers to measure atmospheric pressure. On the buoys, wave data are collected using an accelerometer which measures the vertical acceleration every 2/3 of a second for 20 minutes. Wave heights and periods are mathematically calculated from these time-series accelerations.
Back to topWhat is swell/wave height?
Significant wave height is calculated as the average of the highest one-third of all of the wave heights during the 20-minute sampling period.
Back to topWhat is swell/wave period?
Dominant wave period is the period with the maximum wave energy
Back to topWhat is swell/wave direction?
The direction from which the waves at the dominant period (DPD) are coming. The units are degrees from true North, increasing clockwise, with North as 0 (zero) degrees and East as 90 degrees.
Back to topWhat is wind speed?
Wind speed averaged over an eight-minute period for buoys and a two-minute period for land stations. Reported Hourly.
Back to topWhat is wind direction?
Wind direction (the direction the wind is coming from in degrees clockwise from true N) during the same period used for wind speed.
Back to topThe reported data does not appear to be accurate
The NDBC manages buoy data and is responsible for it's accuracy. Data accuracy is not guaranteed by Buoy Explorer. NDBC quality policy is available online.
Back to topMy question has not been answered
If your issue is not addressed above please email support.
Back to topWho created Buoy Explorer?
Buoy explorer was created by fellow water enthusiast Matthew Morey.
Back to top